ST. LOUIS MAPROOM
Connecting high and low tech tools with community building to better map the many layers of urban environments
Credits
Created by The Office for Creative Research for the Center of Creative Arts
Concept and Creative Direction
Jer Thorp
Data Research and Formatting
Jane Friedhoff, Genevieve Hoffman
Software Design + Development
Jane Friedhoff, Chris Anderson,
Genevieve Hoffman
Robotics Design + Development
Chris Anderson, Dan Gorelick
Exhibition Design + Installation
Noa Younse
Community Facilitation
Emily Catedral, Ann Aurbach
COCA staff
Kelly Pollock, Jennifer Stoffel
Project Coordination
Kate Rath
Role
data research and processing,
software development (map projection tool)
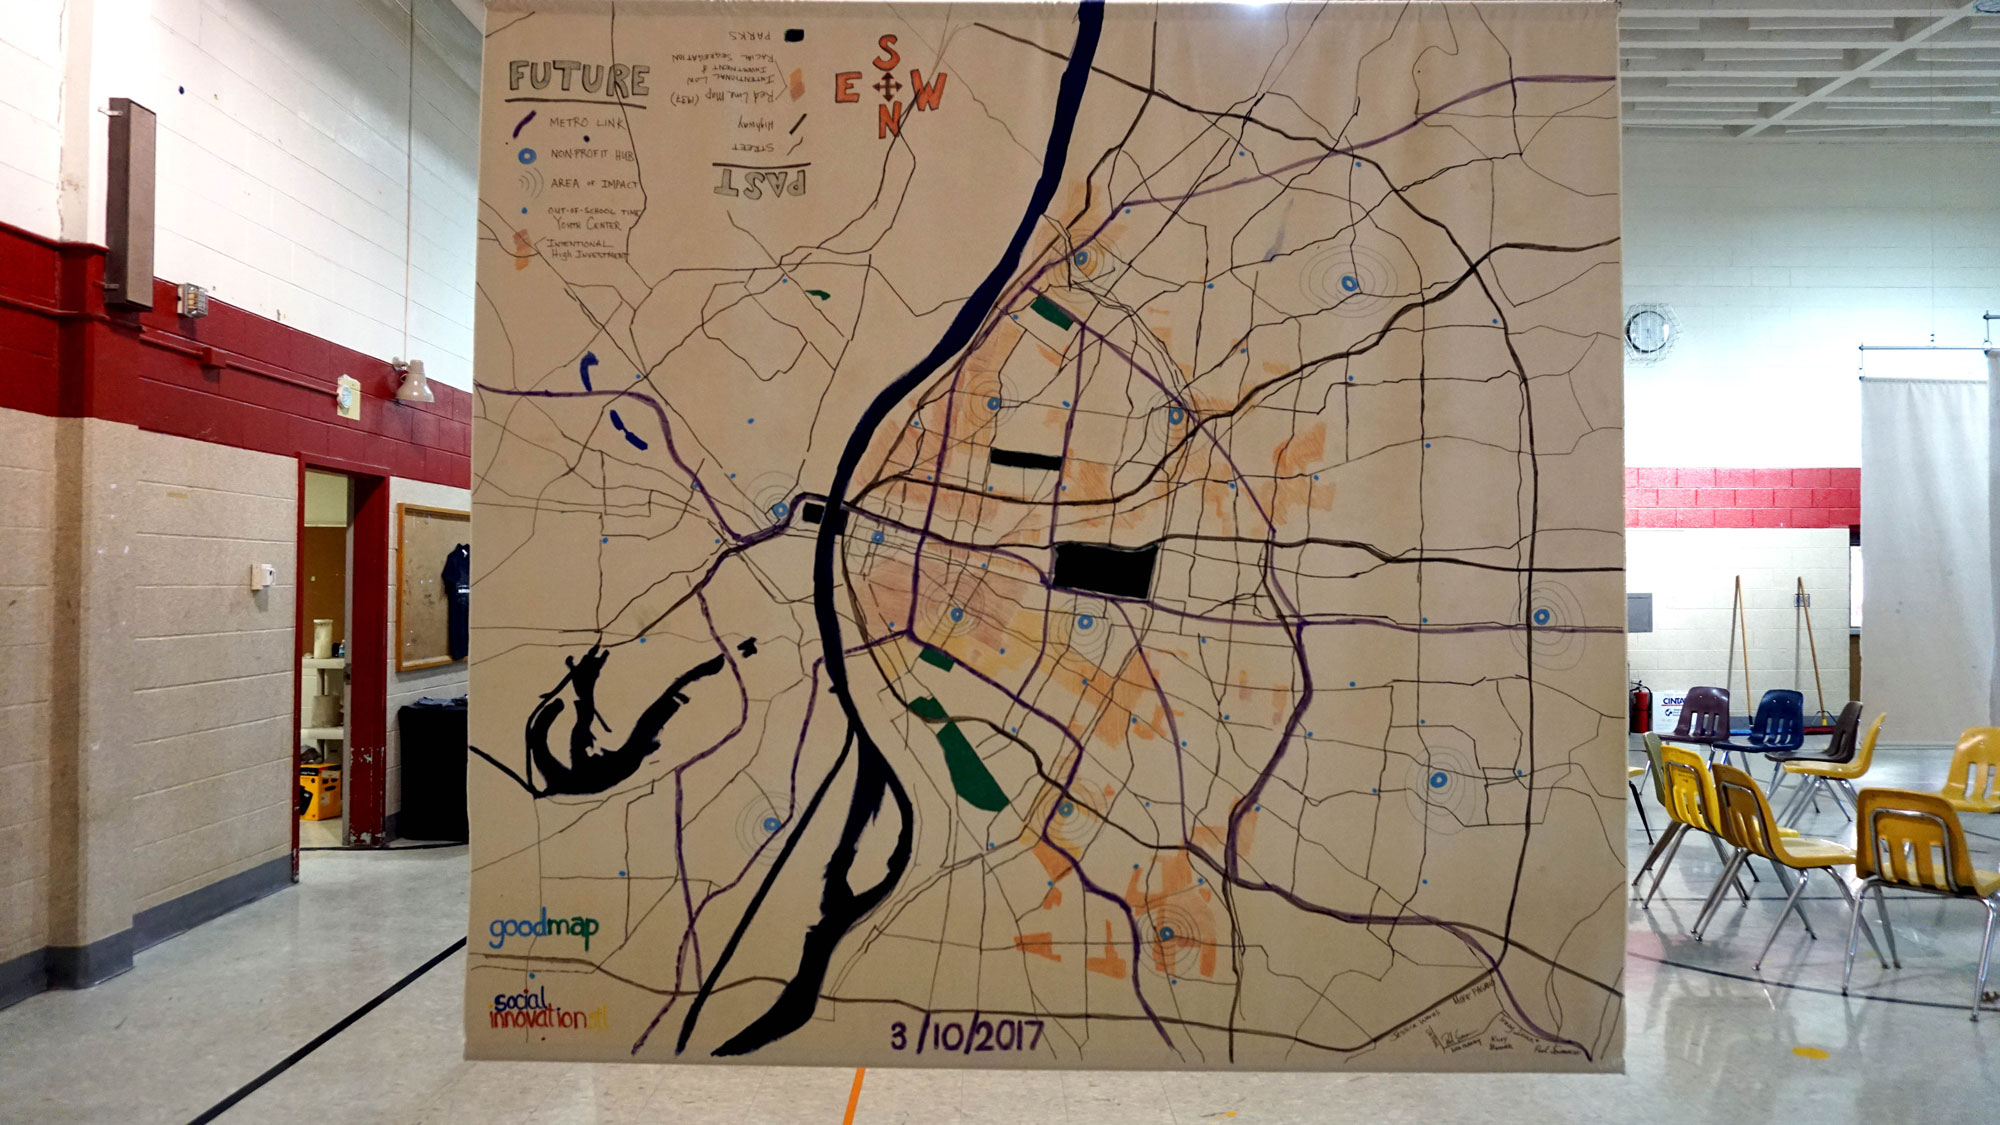
The St. Louis Maproom is an experiment in collaborative mapping as a source of community engagement. Combining technological tools (like drawing robots and auto-zooming projection) with hand-drawn maps allowed community groups to create their own narratives of their city, contextualized with historical maps and other demographic overlays.
Jer Thorp, co-founder and principal of the Office for Creative Research, was invited to have a residency at CoCA arts center in St. Louis. He proposed this idea of creating a Maproom, loosely inspired by World War II when maps formed the basis for a central command center. This maproom would be much different, where the mapping would embody an intersection of humanities, technology, and social justice, as groups of people came together, and through a facilitated process, created a map that represented their experience of the city.
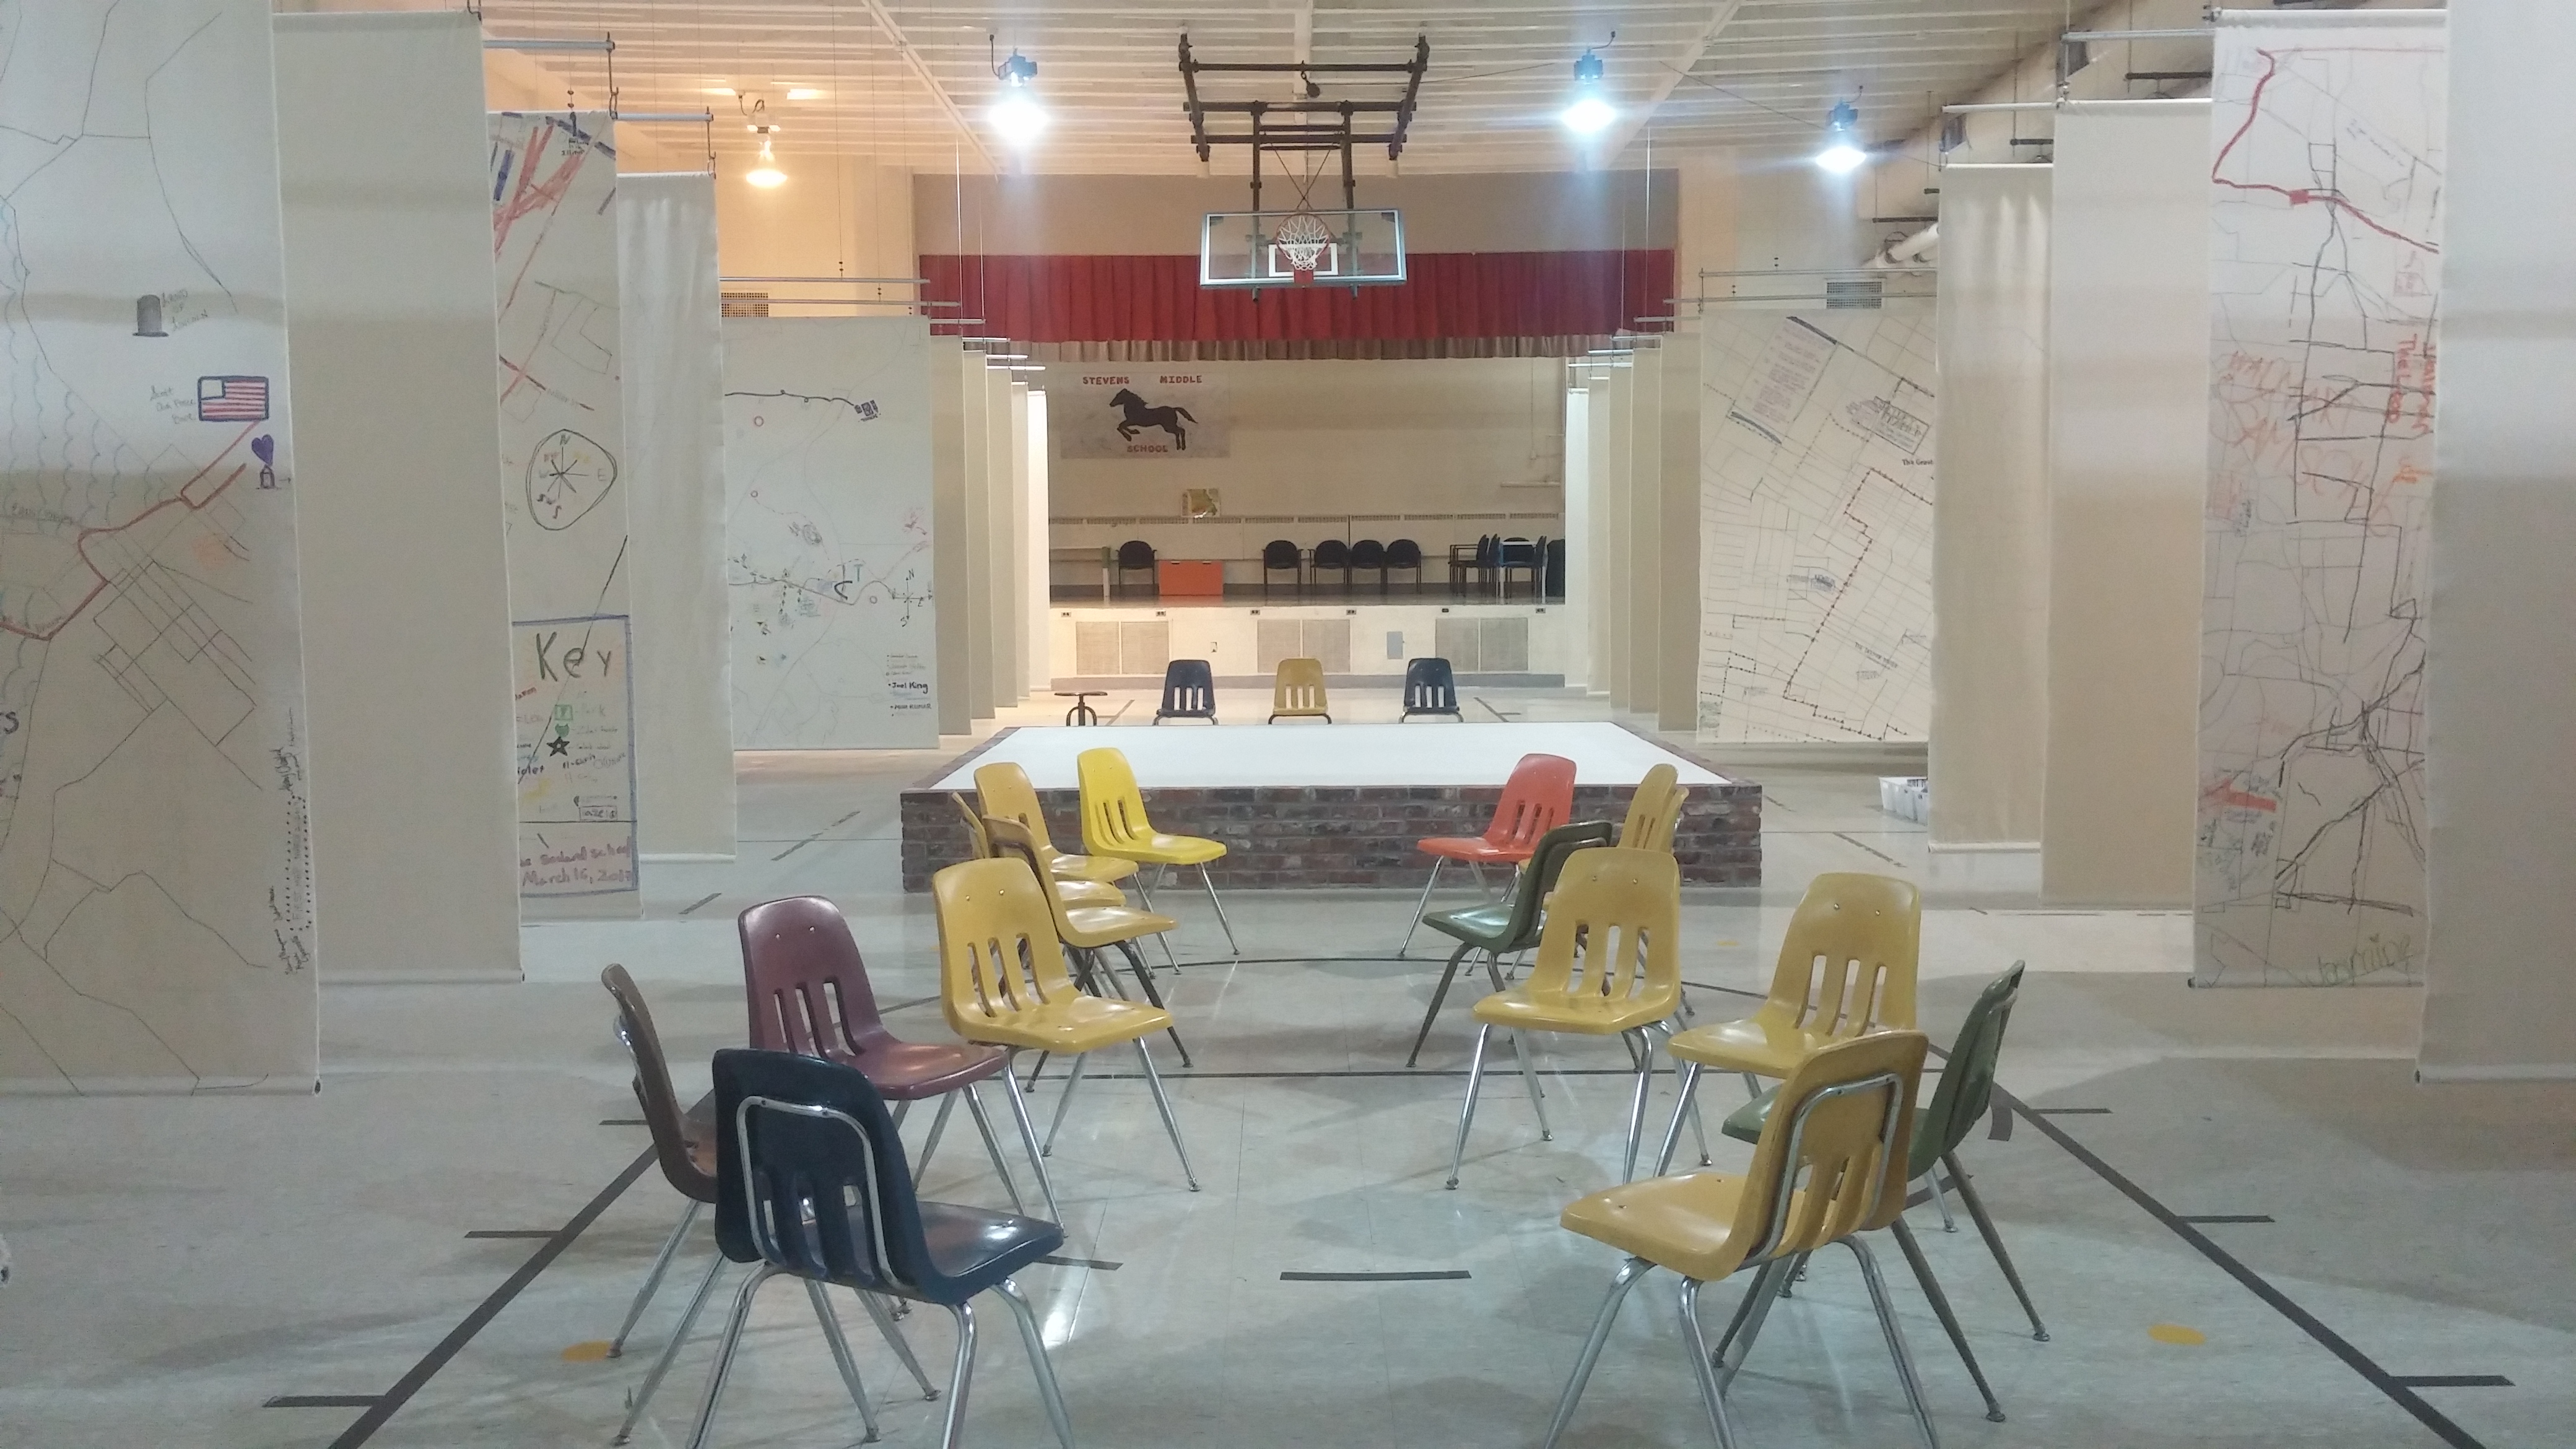
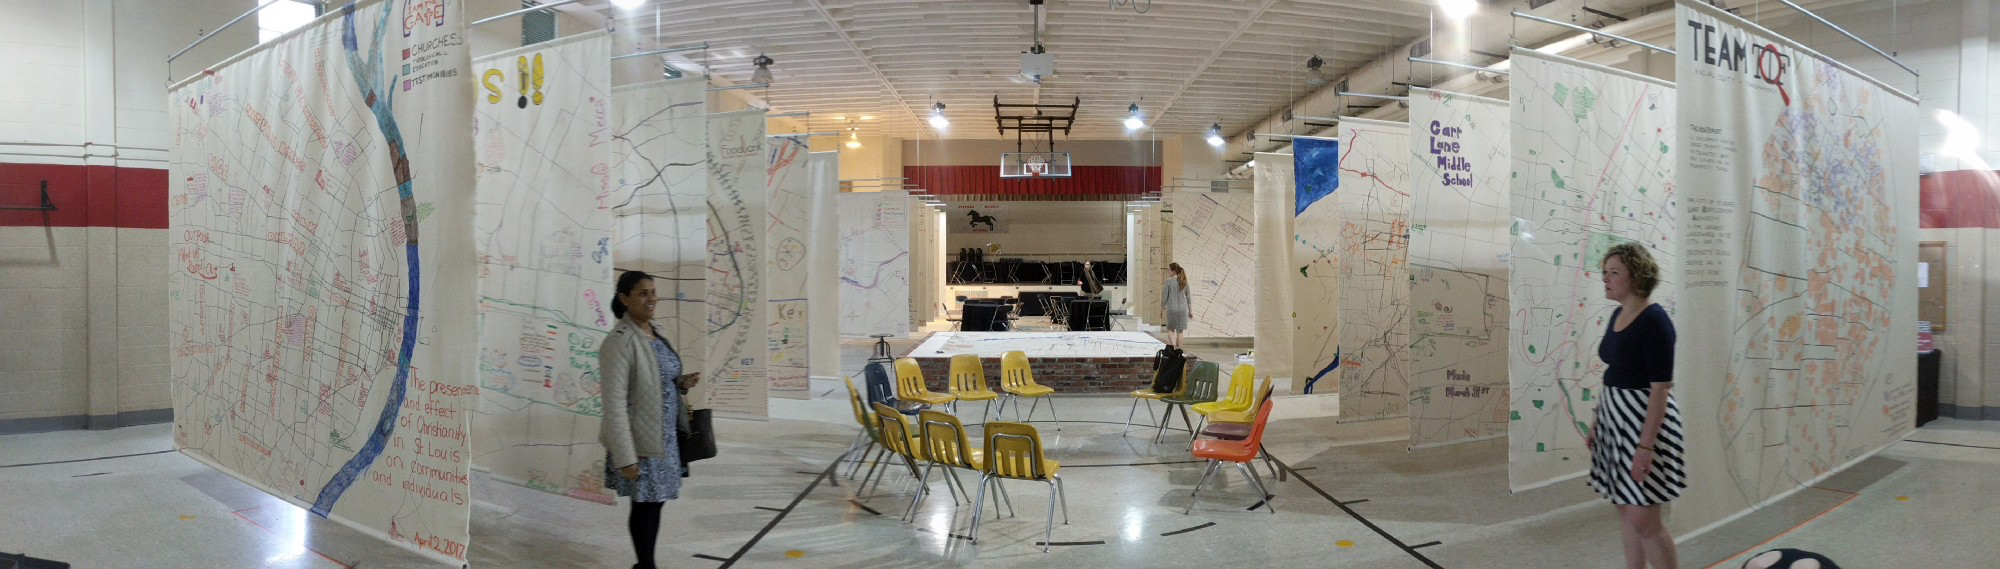
A vacant school’s gymnasium in St. Louis provided a forum for this exploration. In it, over the course of a month, 29 groups came in to make 100 square foot maps of their neighborhoods and communities. They were aided by robots and projection, but primarily drew huge maps by hand that spoke to their lived experience of their city.
Various community groups mapped hand-collected bicycle traffic data, community gardens, churches, magnet schools, and food banks. Student groups mapped their schools, how they got there, and where in their areas it was or wasn’t safe.
Jer Thorp, co-founder and principal of the Office for Creative Research, was invited to have a residency at CoCA arts center in St. Louis. He proposed this idea of creating a Maproom, loosely inspired by World War II when maps formed the basis for a central command center. This maproom would be much different, where the mapping would embody an intersection of humanities, technology, and social justice, as groups of people came together, and through a facilitated process, created a map that represented their experience of the city.
A vacant school’s gymnasium in St. Louis provided a forum for this exploration. In it, over the course of a month, 29 groups came in to make 100 square foot maps of their neighborhoods and communities. They were aided by robots and projection, but primarily drew huge maps by hand that spoke to their lived experience of their city.
Various community groups mapped hand-collected bicycle traffic data, community gardens, churches, magnet schools, and food banks. Student groups mapped their schools, how they got there, and where in their areas it was or wasn’t safe.
Digital to analog mapping tools
Many of us at the OCR came together to realize the Maproom vision. Along with Jane Friedhoff, I researched data about St. Louis that might be interesting to incorporate as a digital overlay to the map. I also built the front-end software that powered the map projection. When a community group came into the Maproom, they worked with a facilitator to hone in on a neighborhood or area they were interested in mapping. We didn't know what zoom level or area they'd want to work on prior to their arrival, so we designed a system that would project a basemap at any zoom level onto the canvas that they would be using for their map.

Early rendering by Noa Younse of the installation in the abandoned gymnasium. Robots would draw the basemaps with completed maps hanging alongside.
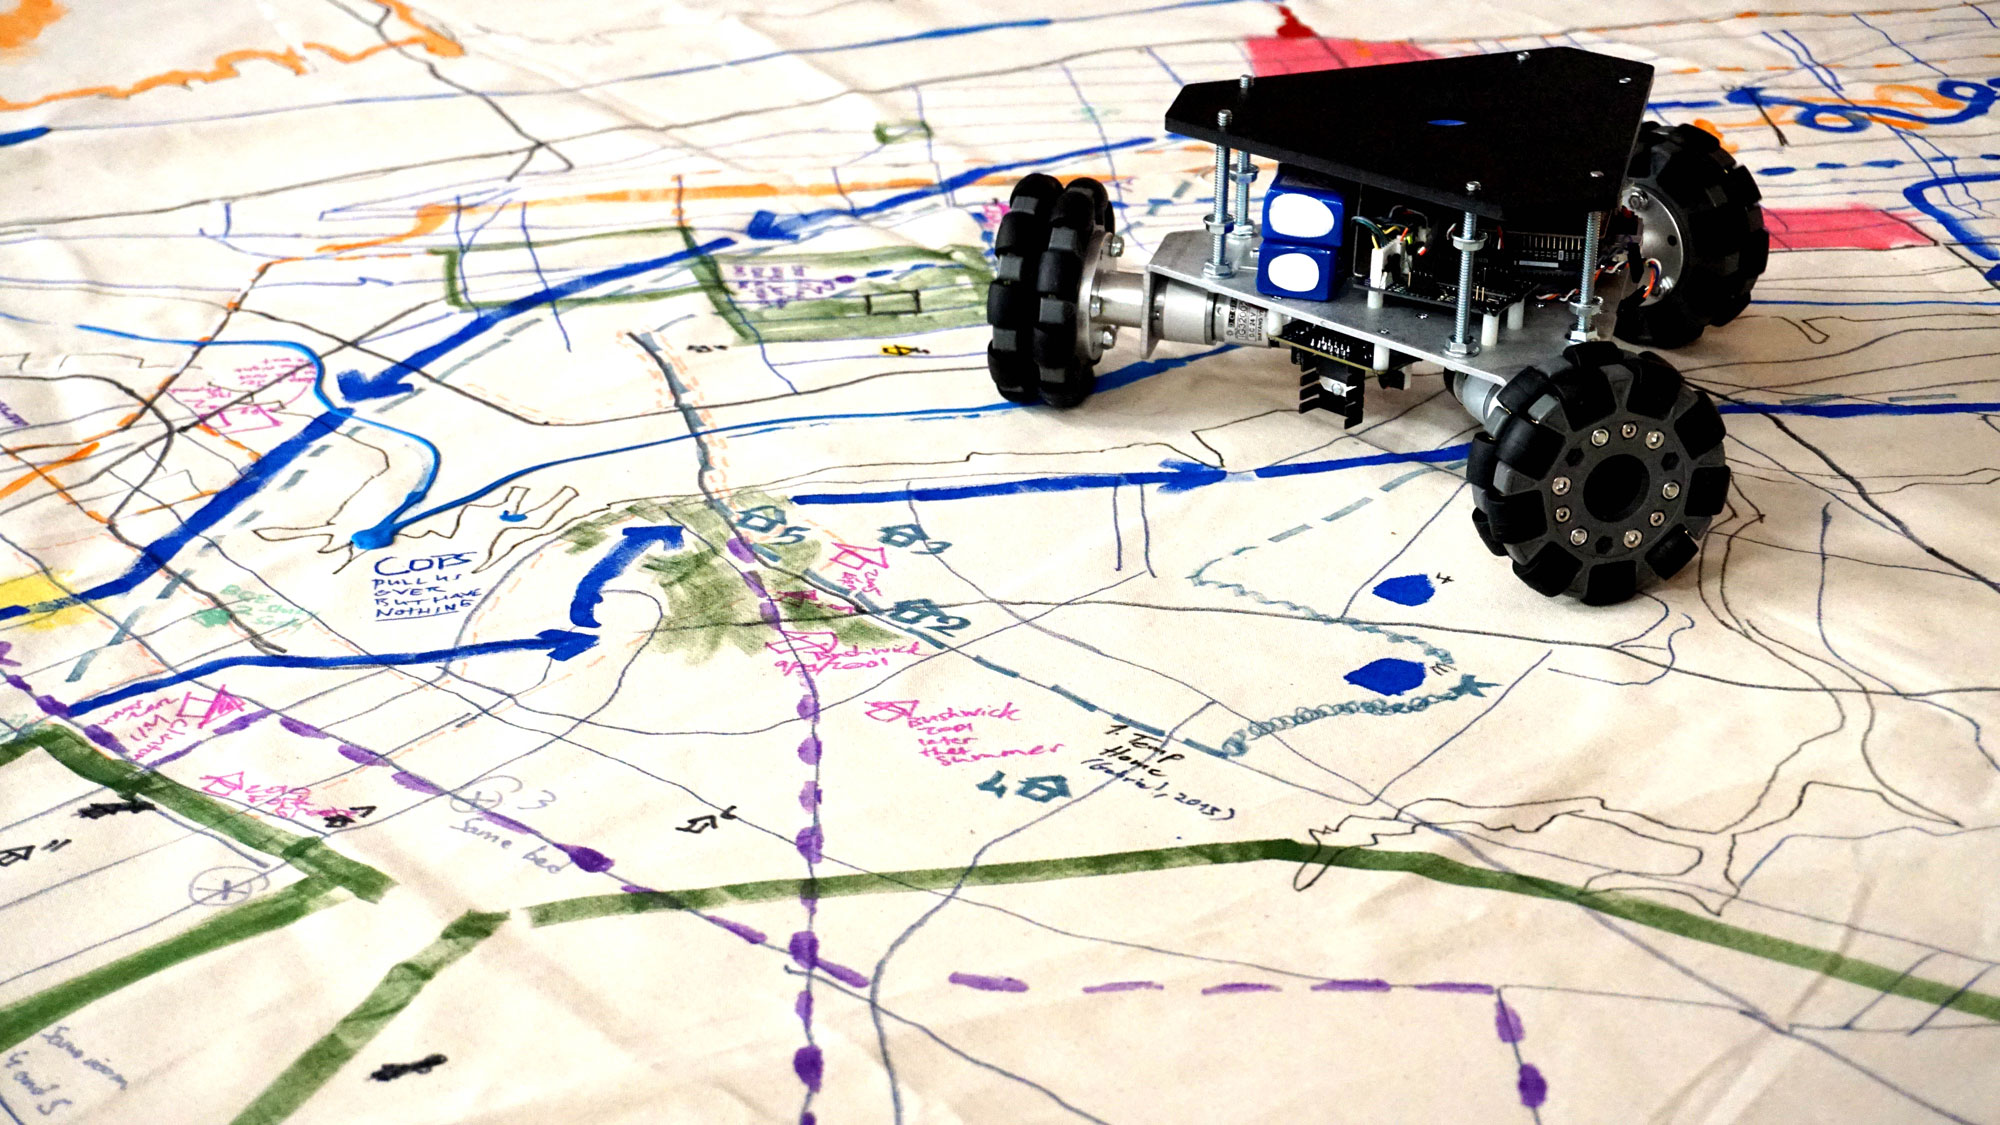
The basemap would be traced by drawing robots with black sharpie as they worked with each other to determine the focus on the map they would be drawing over it. The front-end projection software received input from an iPad specifying the zoom level and area to be projected.
A drawing robot designed to trace basemap layers with sharpies and other drawing implements
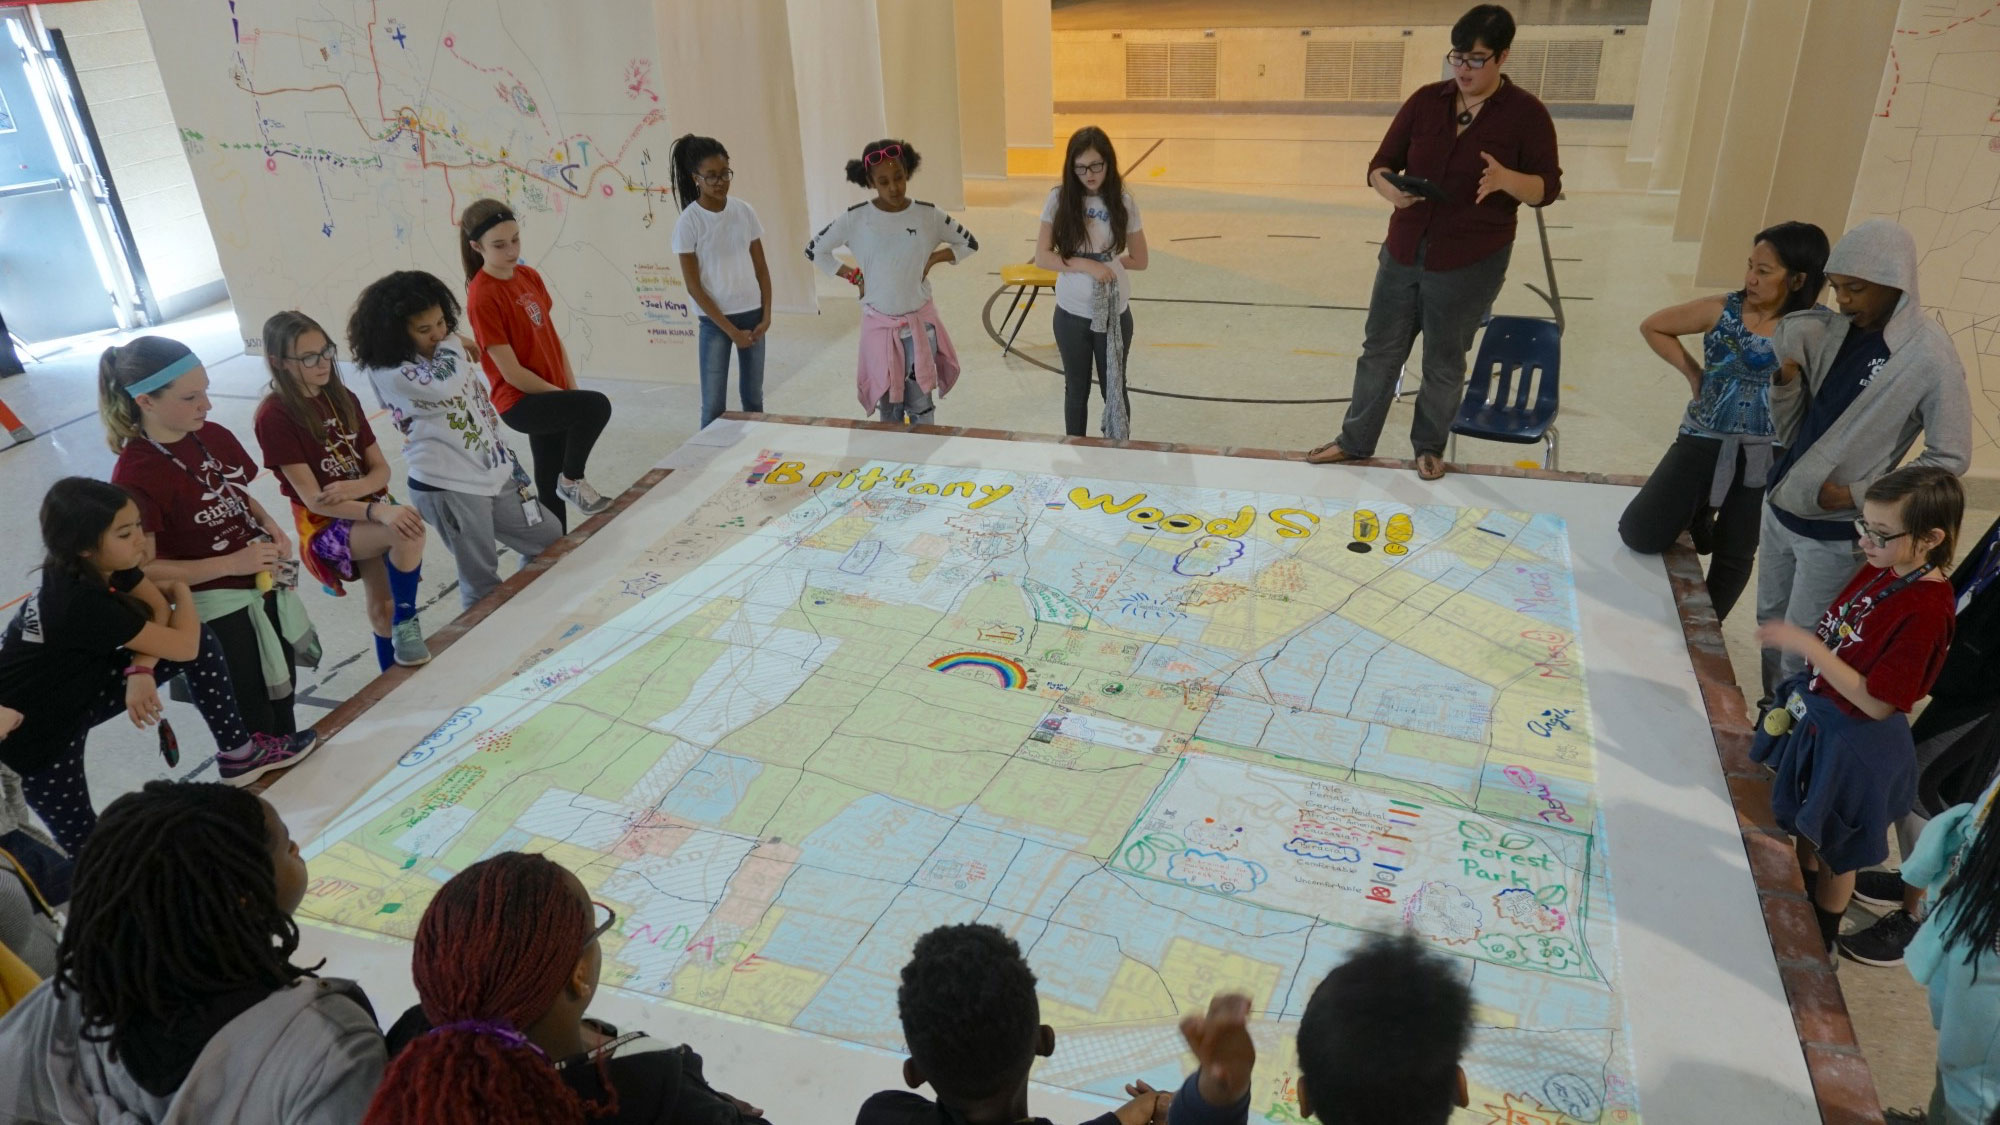
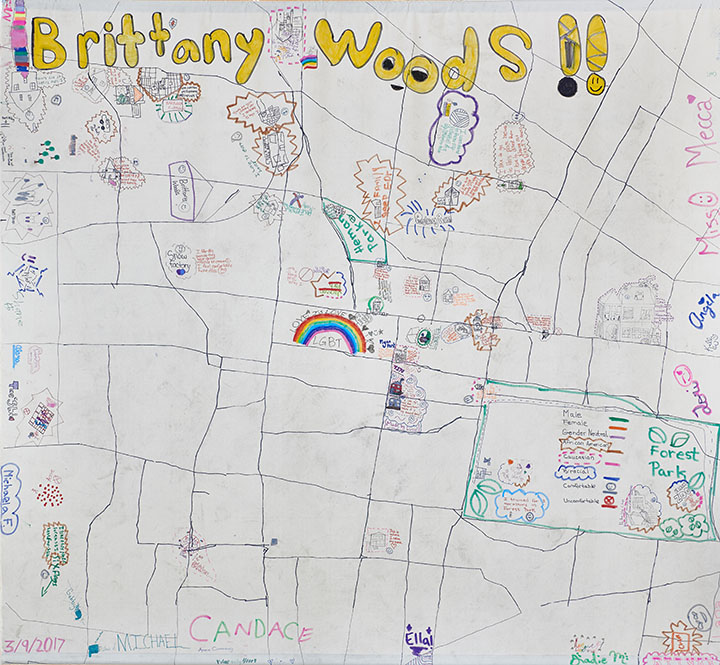
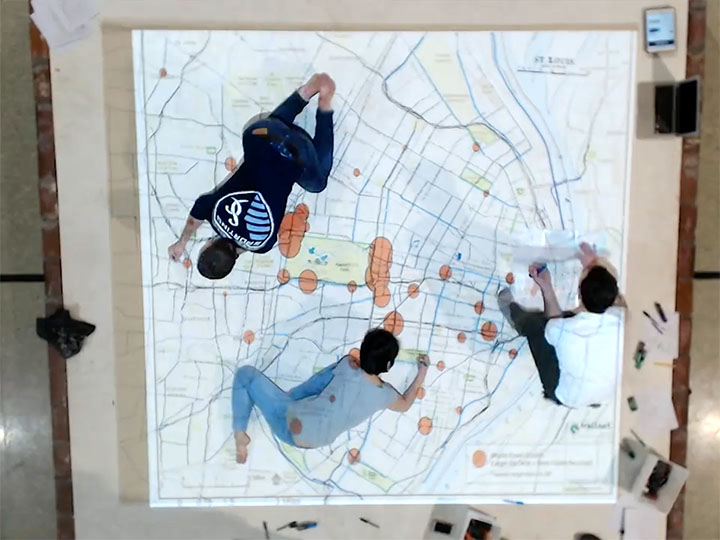
On the left, a timelapse of a group of students from Brittany Woods Middle School making their map and the completed map on the right.
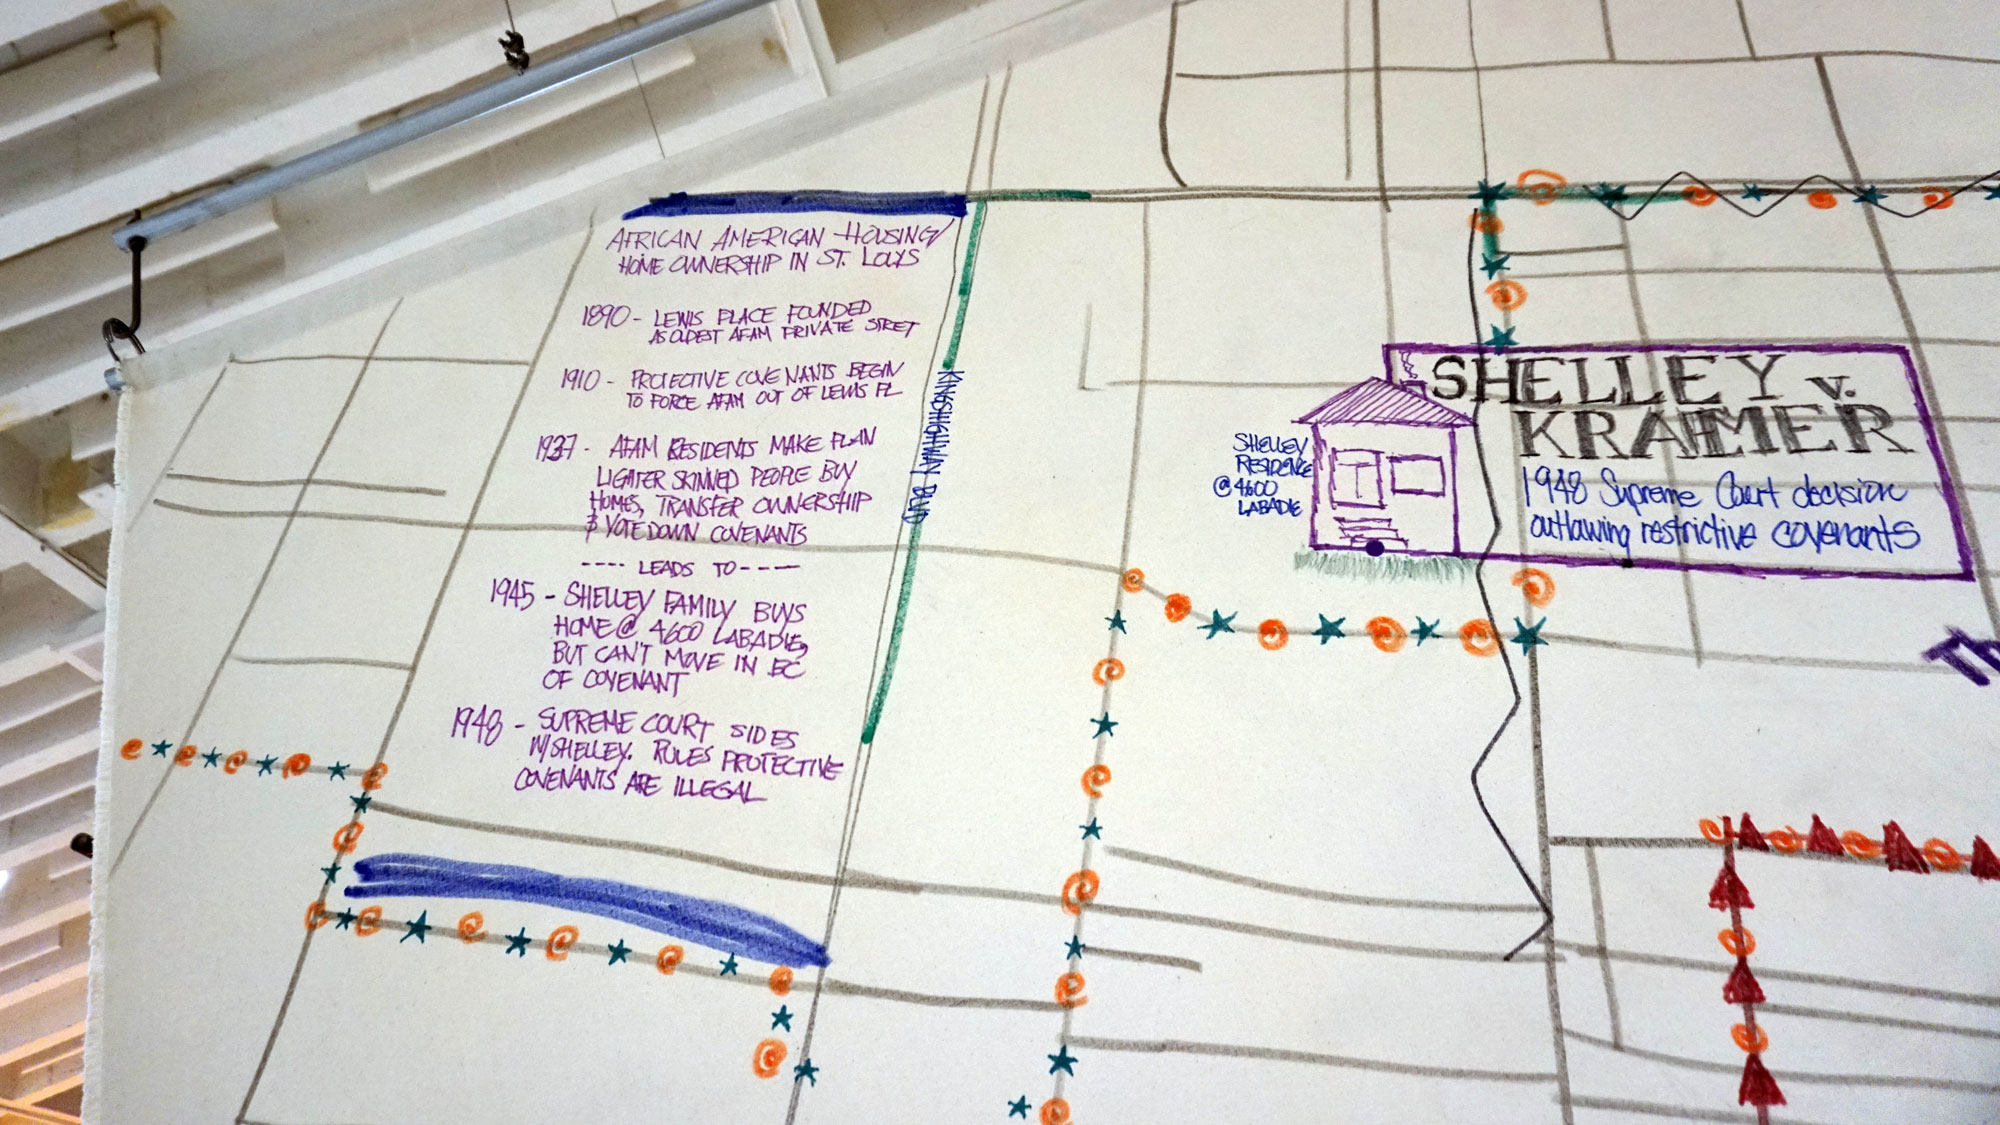
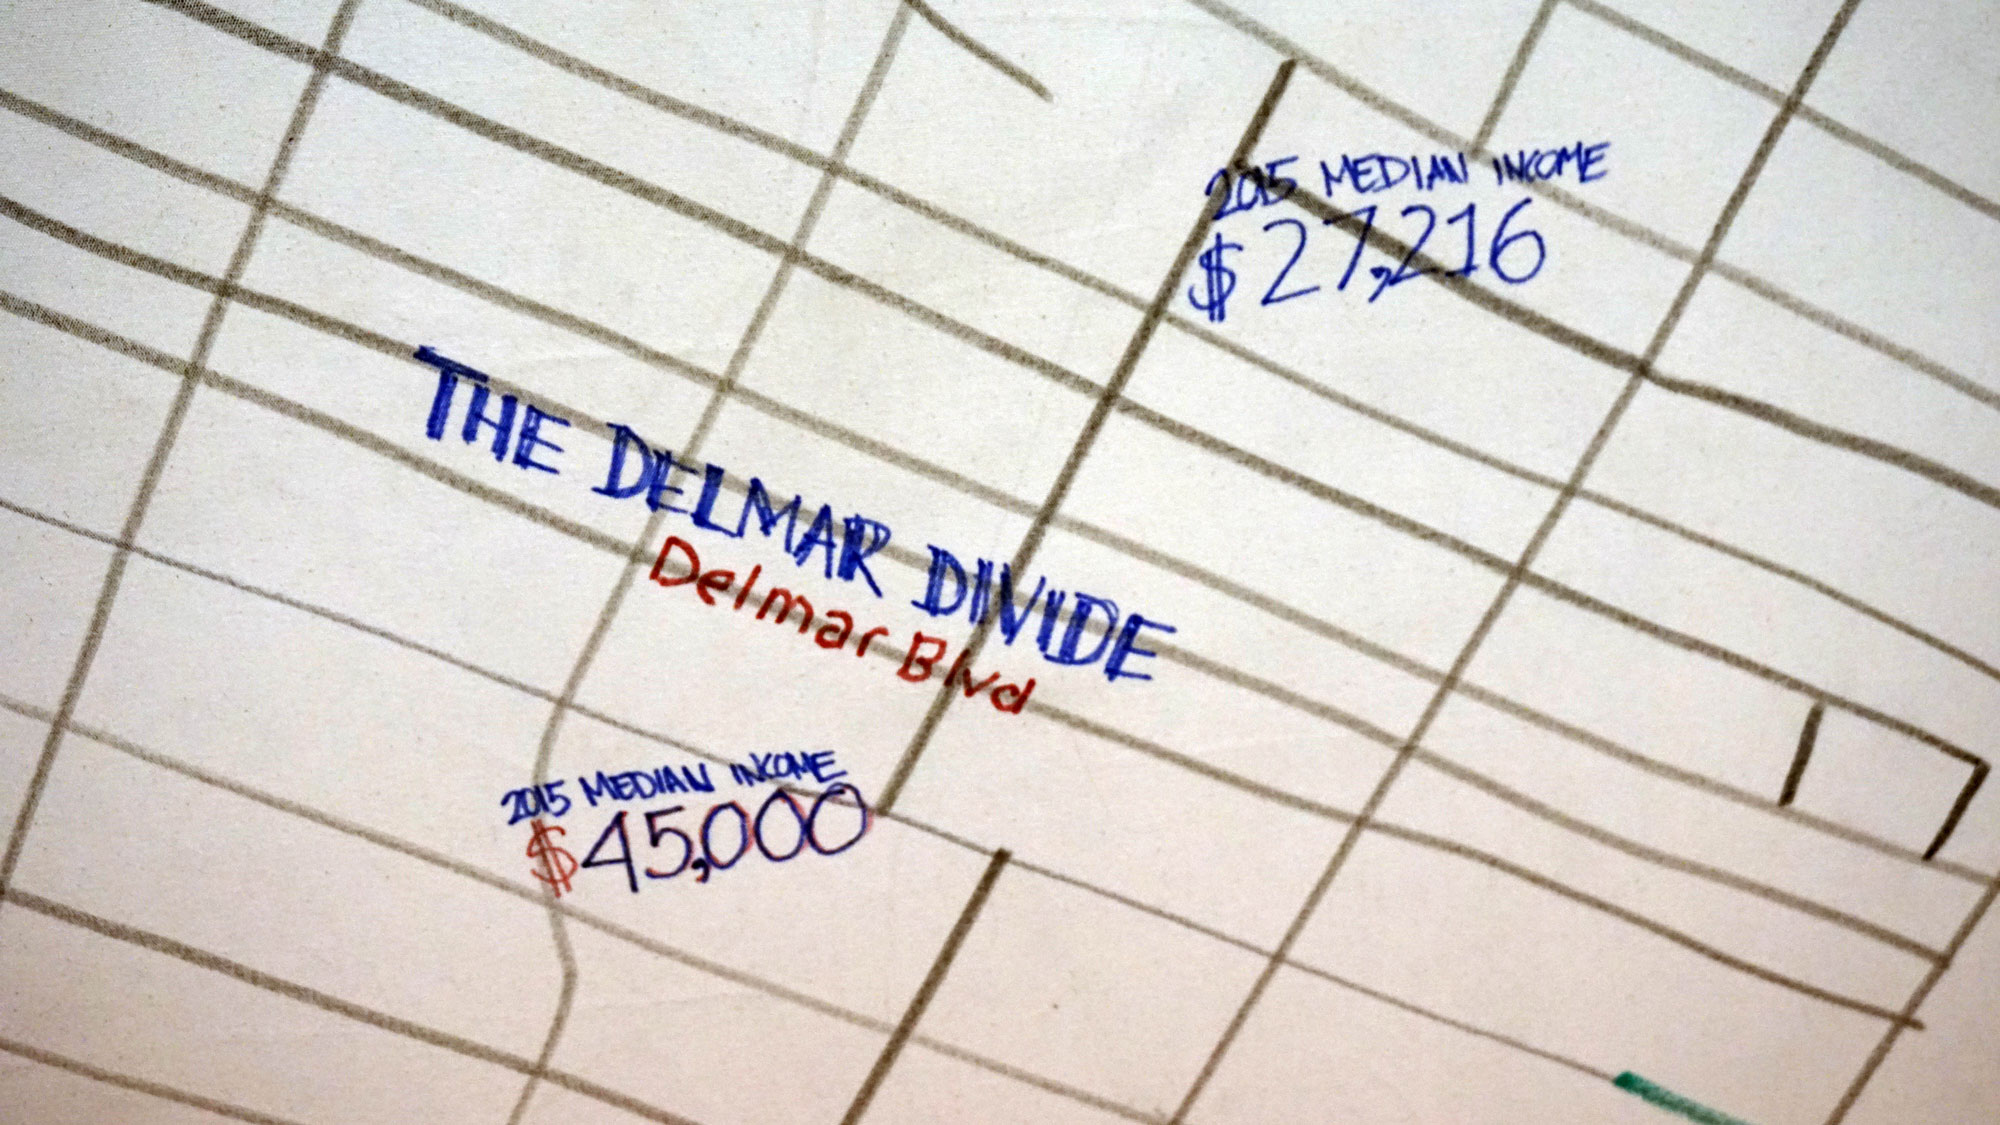
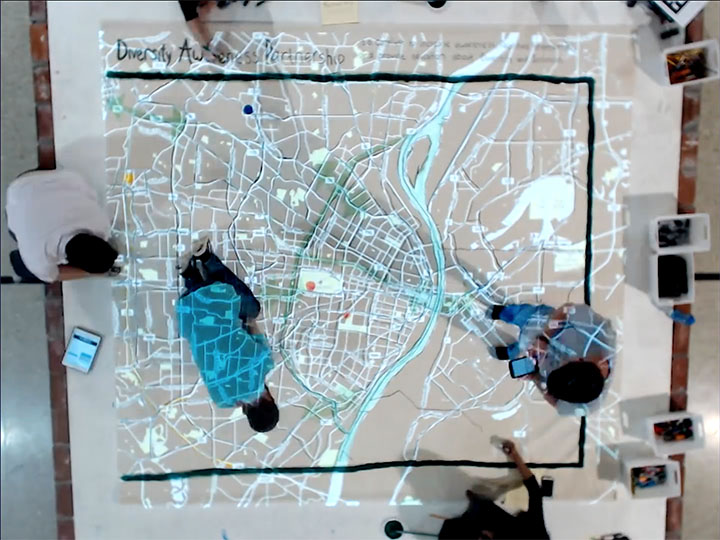
Once a map was drawn, we projected onto it civic data collected from St. Louis: everything from bus lines to poverty levels to historical red-lining maps. Normally these data are difficult, if not impossible, to access without deep technical knowhow. The mappers were surprised to see their experiences confirmed - or challenged - by data that were invisible to them before. And when they perused the maps that other groups had done before them, they got to experience their city through the eyes of their neighbors.
Overhead projection of various data layers about St. Louis. These were projected onto the basemap for tracing outlines and later analyzing demographic and other historical data trends
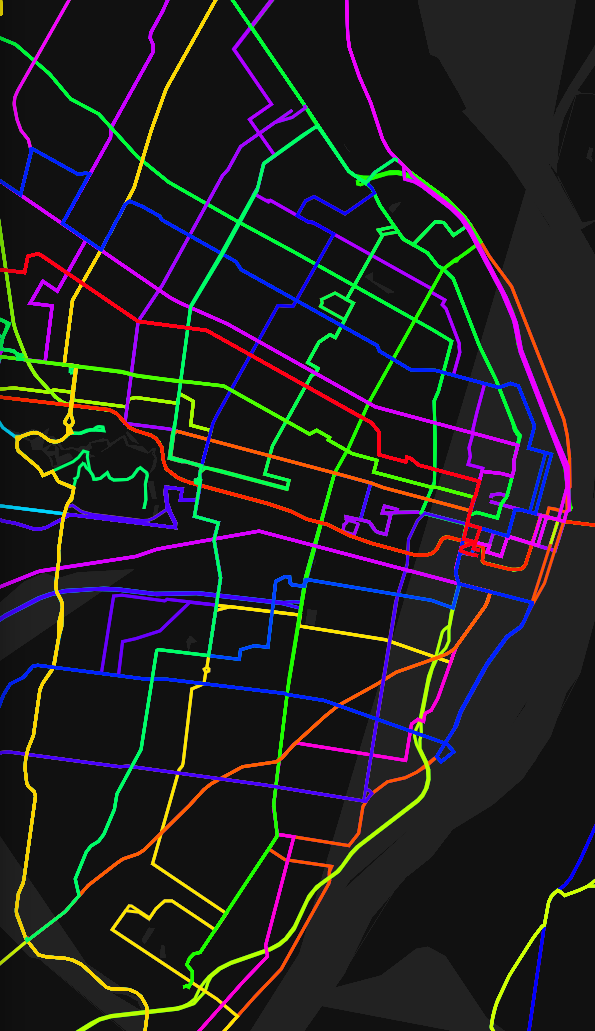
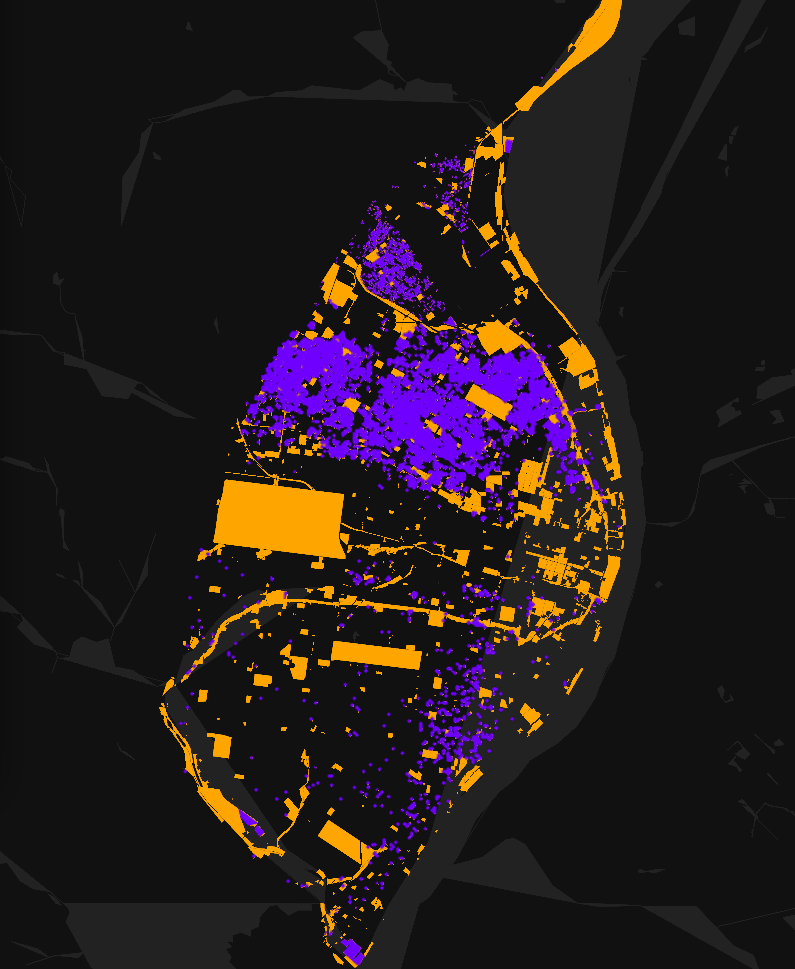
Screenshots of the map layers designed to be projected. We styled the basemap layers black or very dark shades of gray so that they wouldn’t appear in a projection (black projects as the absence of light). We chose bright saturated colors that would be easy to see on canvas for the data layers. Map layers were styled in Mapbox Studio using Open Street Map data.
An early prototype of the ipad app interface to allow facilitators to select basemap and data layers for projection

Mapping as community engagement, understanding and archiving
We were overjoyed by the response to the project. Over 29 maps were made, with many different representatives from the community participating. The City of St. Louis even declared April 11th, the day the installation closed, St Louis Map Day!
This flagship Maproom has inspired other cities to use a similar framework and toolkit to create their own map-based methods to facilitate conversation around what’s important to the cities we live in.
This flagship Maproom has inspired other cities to use a similar framework and toolkit to create their own map-based methods to facilitate conversation around what’s important to the cities we live in.
Video documentation of the installation made by the Center of Creative Arts (COCA) in St. Louis