
ON DOLLAR SLICES, PIZZA VECTORS, PROSCIUTTO ZONES AND TOPPING HYPERSPACE
Using data science to understand New York City through its most famous food
Credits
Topos - Will Shapiro, Mahir Yavuz, Genevieve Hoffman
Role
concept, data research, data scraping, data analysis, prototyping, writing
Topos - Will Shapiro, Mahir Yavuz, Genevieve Hoffman
Role
concept, data research, data scraping, data analysis, prototyping, writing
This article takes a data science deep dive into a relatively light-hearted dataset, pizza toppings, in an effort to demystify data science principles by applying them to culturally relevant topics. You can read the full article over on Medium.
Context
The first thing I did after joining Topos as a Data Visualization Engineer was to pitch a data-driven article that aligned with their mission to use AI and machine learning to better understand cities through a cultural lens. Inspired by a jet-lagged dollar slice meal a few days prior, I suggested using data about pizza in New York City to inform our investigation and article. They enthusiastically agreed, and so I embarked on gathering a dataset about pizzerias, their prices and what types of toppings they offered, with a hunch that pizza toppings could be a good indicator of other qualities a neighborhood might have - level of income, rate of gentrification, and other demographic indicators.
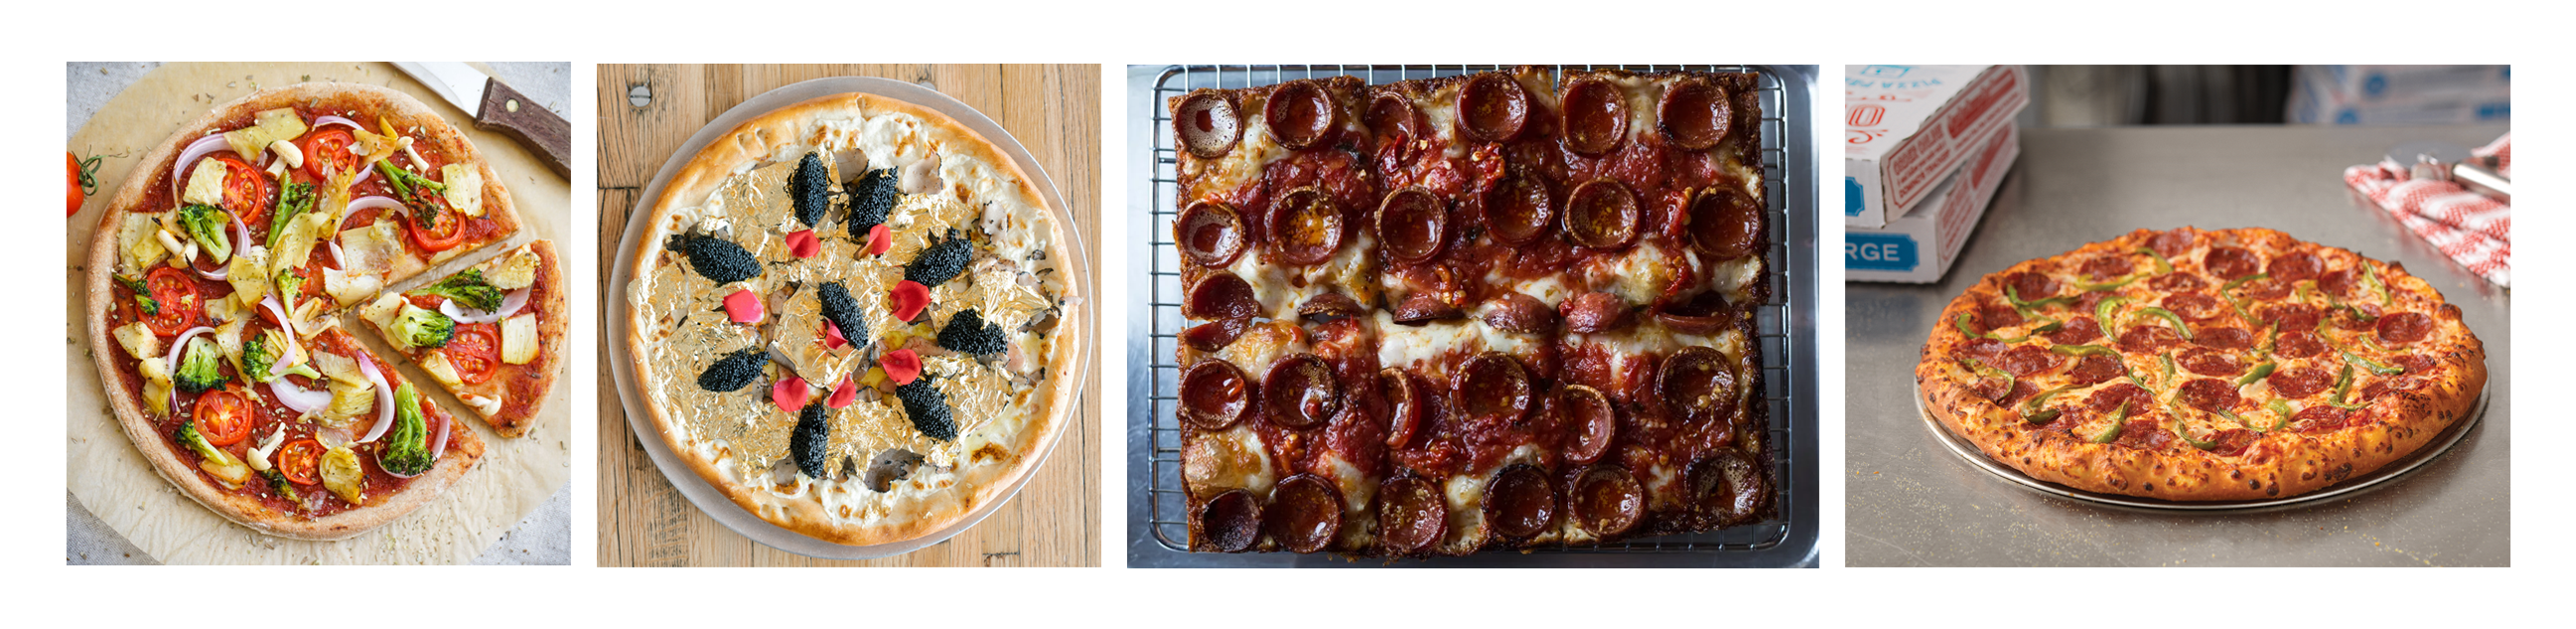
From left to right: vegan pizza, $2000 gilded truffle pizza, neo-sicilian pizza from Emmy Squared, Domino’s
Finding the data
In order to perform analysis, we needed a machine-readable dataset about pizza, but one that went beyond just location and price point. I wanted to understand both the economics of pizza, as well as the variety of styles, so set about scraping menus from pizzerias to capture the kinds of toppings they offered, as well as the price point for the essential pizza economic indicator - what a slice of cheese costs.
I used nodeJS and the puppeteer library (which allows for headless browsing) to scrape menus from a few restaurant aggregators like Yelp and Google. The puppeteer scripts looked out for common css classes and keywords to save a json file for each restaurant with the toppings offered and prices for each pizzeria. Limits of time did not allow for digitization of the many pizzerias with pdf menus, but we hoped to understand where the hipper pizza toppings like sopressata or truffles might be, and those restaurants tended to have machine-readable menus.
I used nodeJS and the puppeteer library (which allows for headless browsing) to scrape menus from a few restaurant aggregators like Yelp and Google. The puppeteer scripts looked out for common css classes and keywords to save a json file for each restaurant with the toppings offered and prices for each pizzeria. Limits of time did not allow for digitization of the many pizzerias with pdf menus, but we hoped to understand where the hipper pizza toppings like sopressata or truffles might be, and those restaurants tended to have machine-readable menus.
The Economies of Pizza
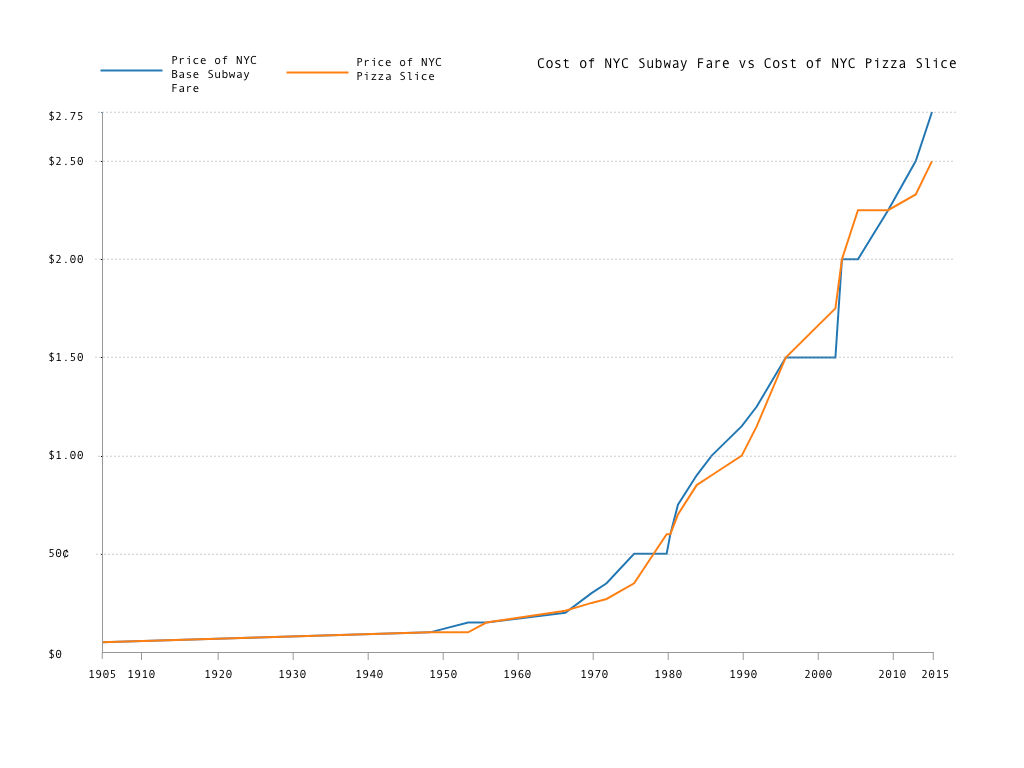
From research into other journalistic pizza-themed exposés, I dug further into NYC-specific pizza economies - like the Pizza Principle (or Pizza-Subway Connection) where economists had noticed a correlation between the MTA raising subway fares and how much a cheese slice cost in New York City.
Graph correlating the price of a slice with the cost of a subway ride in New York City
Only in New York City can you find so many pizzerias offering pizza for a dollar a slice, a business model only made possible by the sheer volume of foot traffic areas of Manhattan afford. By mapping dollar slice pizzerias, it became clear that there was a distinction between the high foot-traffic daytime areas like Midtown, and the high foot-traffic nighttime areas like the Lower East Side, but both offered the possibility of dollar slice business models, either targeting the lunch rush or the late night crowd.
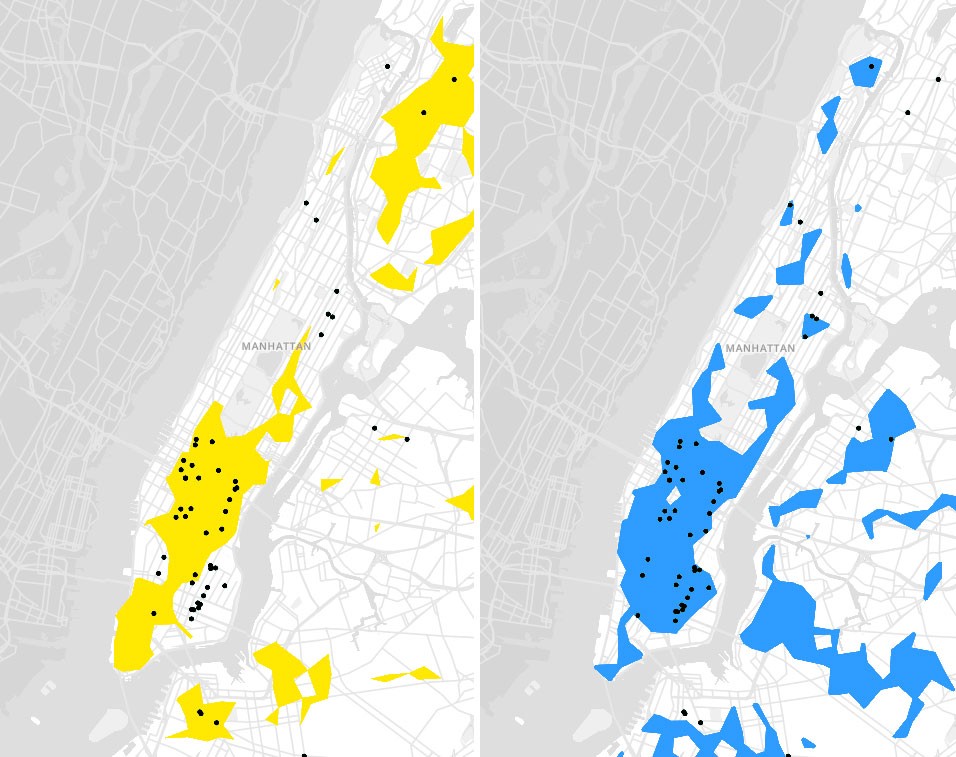
Comparing daytime traffic zones in yellow with nighttime traffic zones in blue. Dollar slice pizzerias are black.
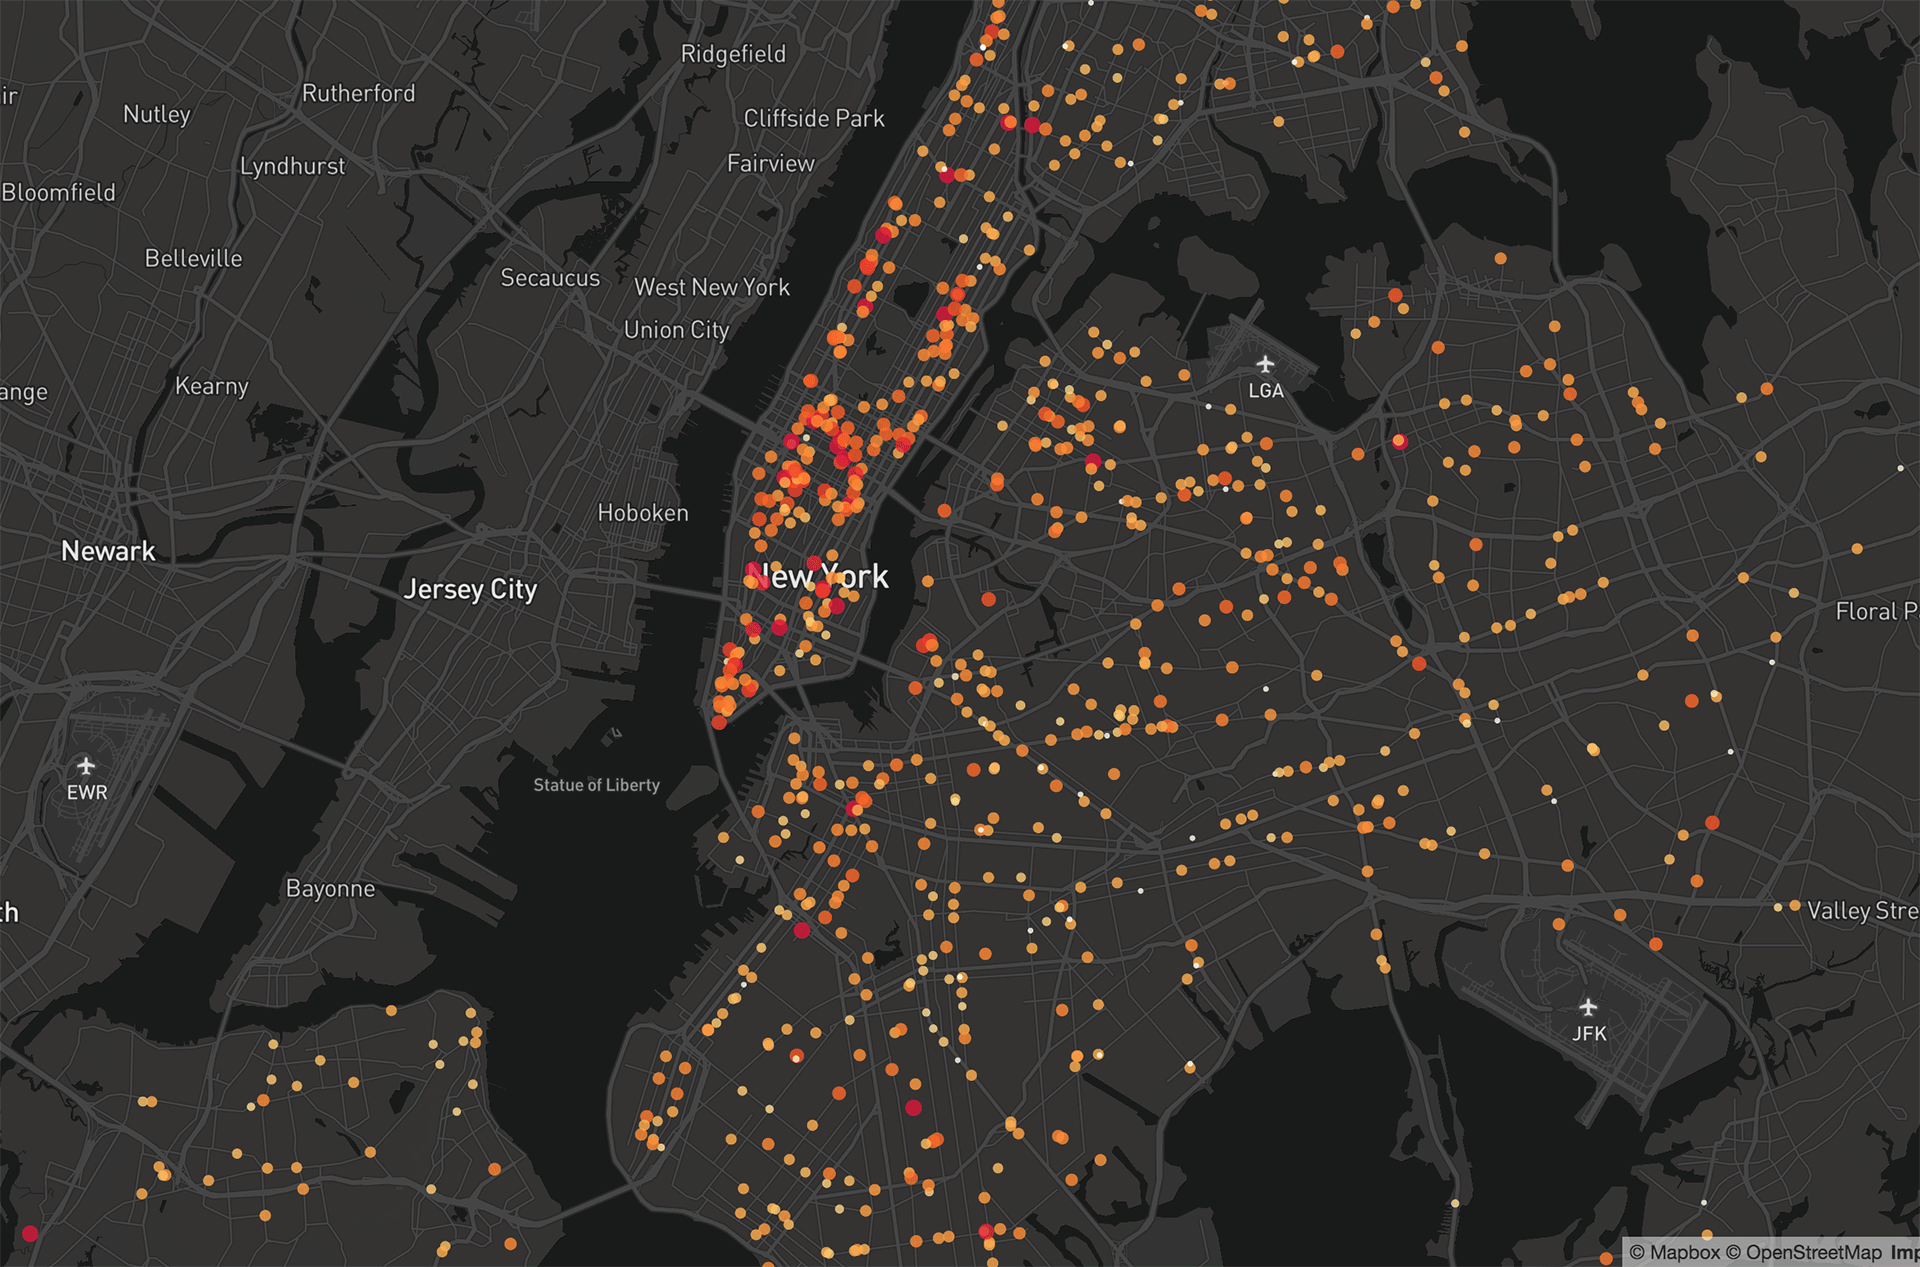
I also made maps evaluating pizzerias by the price of a large cheese pizza or the price of a cheese slice. Interestingly, prices for Papa Johns and Domino's varied by pizzeria locations.
Mapping the cost of a large cheese pizza across the city. Cost varied between $9 (yellow) to $25 (red)
The Geographies of Pizza
In addition to looking at the economic aspects of pizza, we were curious about other geographic patterns within our pizza dataset.
One aspect we found when looking into dollar slices, were that most pizzerias are located within a 5 minute walk from a subway station, confirming our hypothesis that foot traffic is key to making the pizza economy run. While pizza delivery might be the thing in other cities, in New York City, pizza is largely a walk-in, eat-by-the-slice experience.
One aspect we found when looking into dollar slices, were that most pizzerias are located within a 5 minute walk from a subway station, confirming our hypothesis that foot traffic is key to making the pizza economy run. While pizza delivery might be the thing in other cities, in New York City, pizza is largely a walk-in, eat-by-the-slice experience.
All the pizzerias in NYC (black), with the walking distance to subway stops in yellow. Animation by Mahir Yavuz.
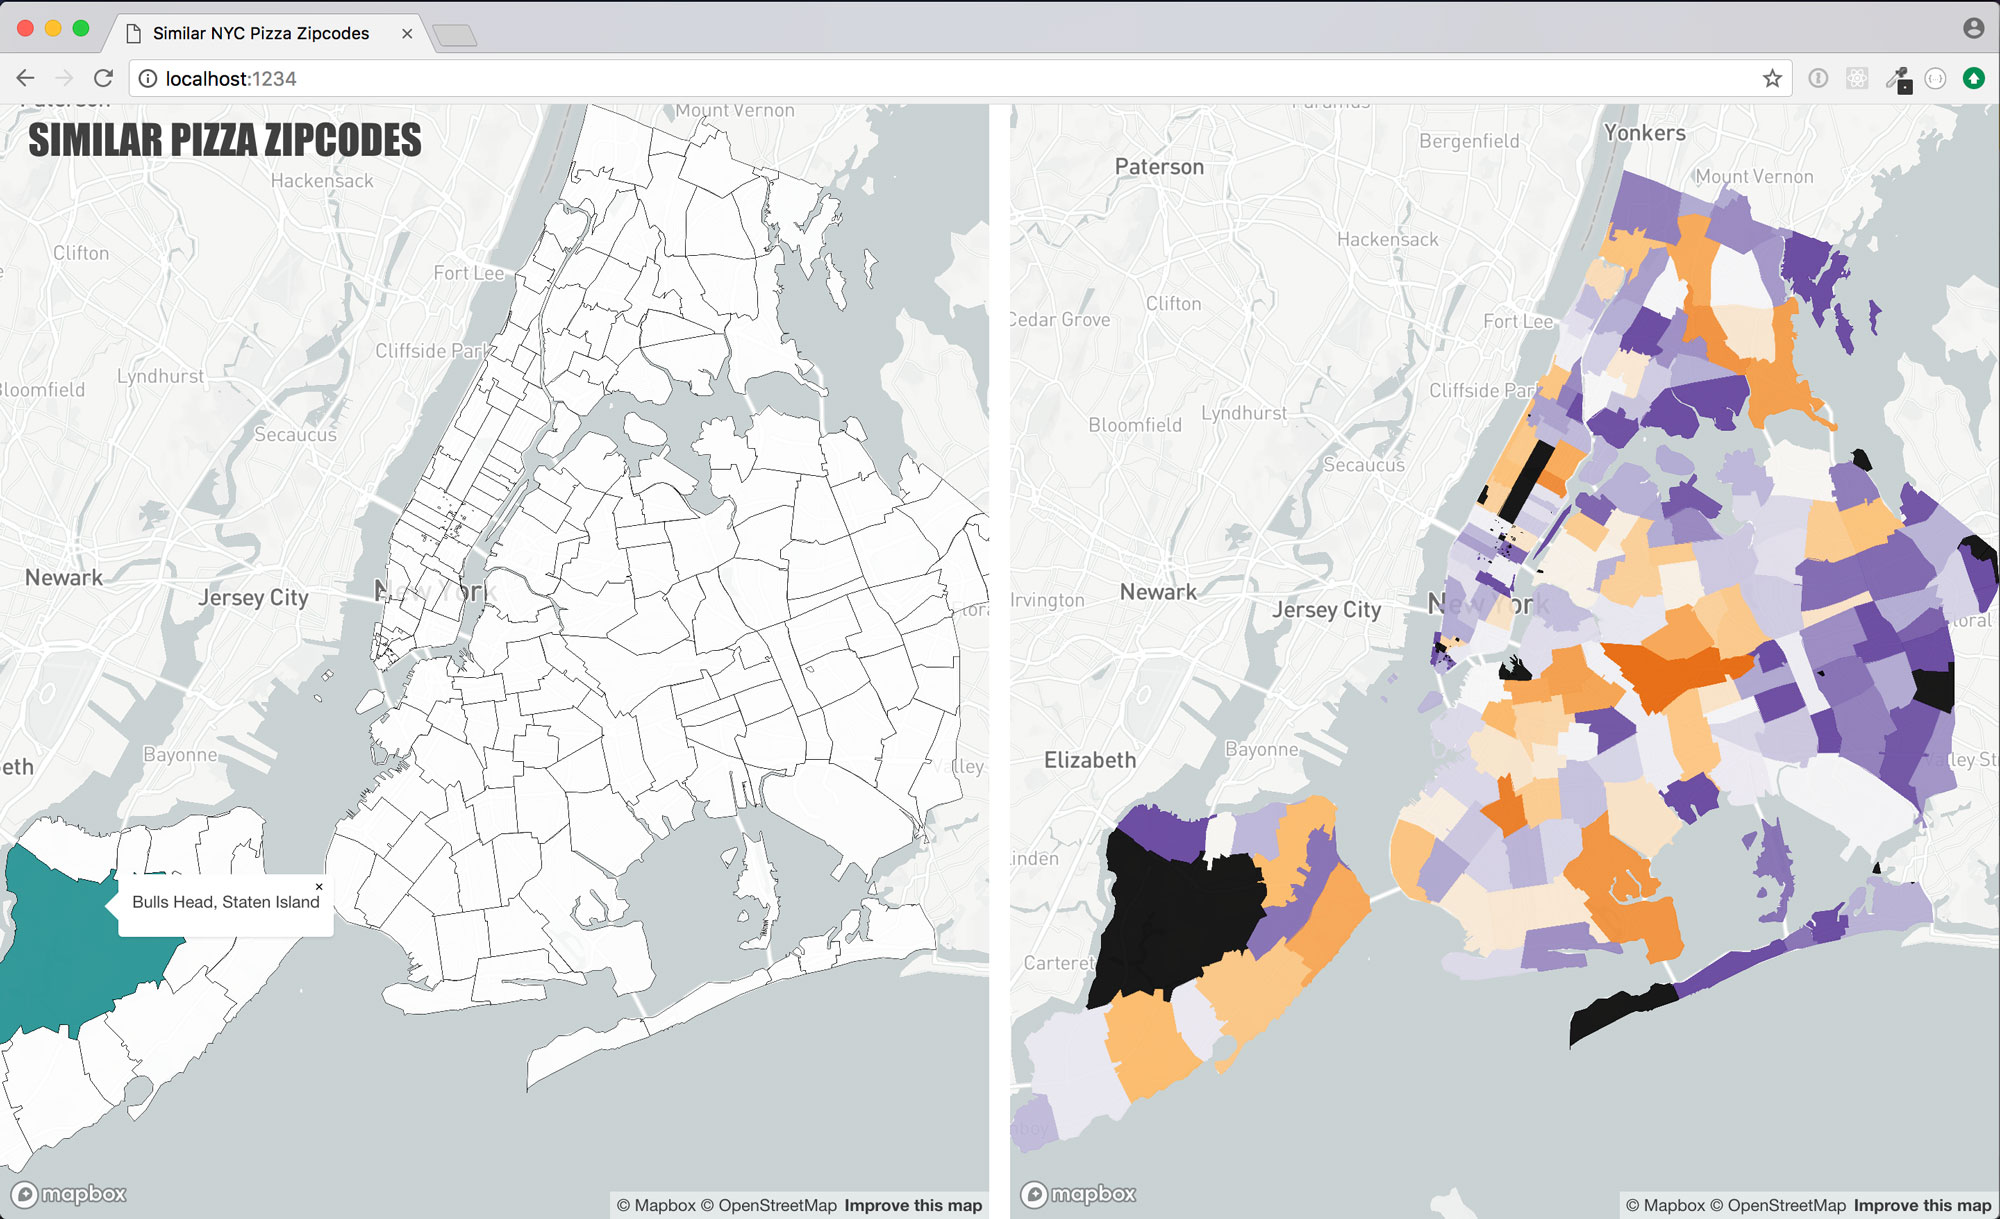
One thing we did a lot at Topos at the time, was compare different neighborhoods to one another based on various dimensions (data science speak for types of data). Oftentimes it's easier to compare geographical areas according political boundaries, since many kinds of data are attached to them. We first looked at zipcodes as a starting point, since many types of demographic data are found on a zipcode-level, and many zipcode boundaries do have some similarities to the neighborhoods found in a city. We made a few prototypes trying to find the most similar pizza zipcodes, and though the similarities made sense on some level, we ultimately wanted more granularity.
Prototype of finding the most similar pizza neighborhoods by zipcode. Selecting a zipcode on the left displayed the most similar (orange) to the least (purple). Black zipcodes lacked adequate data (pizzerias).

S2 cells allowed us the granularity that was lacking with zipcodes. We began clustering New York City by s2 cells according to the dimensions of pizza toppings the cells contained. First, we had to determine a classification system to differentiate fancy pizza toppings, like prosciutto, bufala mozzarella, truffles and shitaki mushrooms, from regular pizza toppings, like pepperoni, sausage or menu items like calzones.